The heat map
Credential compromise
- Likelihood
- 2 of 5
- Impact
- 3 of 5
- Rating
- Green
- Source
- Q3 self-assessment
- Evidence
- “MFA enforced? Yes.”
25+ years in security leadership, and I’ve sat through more watermelons than I can count. Red, yellow, and green built from questionnaire answers isn’t measurement. It’s vibes with a legend.
Draxis reads the controls you already run, pulls KRIs, and shows exposure as P10/P50/P90 ranges instead of one terrifying number someone made up in Excel.
 Nick Kathmann, founder of Draxis
Building board slides this quarter? Here’s what to show instead of a heat map.
Building board slides this quarter? Here’s what to show instead of a heat map. Compliance isn’t security. Here’s what to put on the board slide instead of a compliance report. Your board wants to know if risk is going up or down. A color can’t tell them. A trend and a dollar range can. Same risk, same day: green on the heat map, amber and red in the tools. Here’s how that looks side by side. KPIs show what the team did. KRIs show whether exposure moved. Here’s a board slide built on KRIs.Or just take the KRI definitions, free, no email.
No signup. The login is filled in for you, and the demo opens in a new tab.
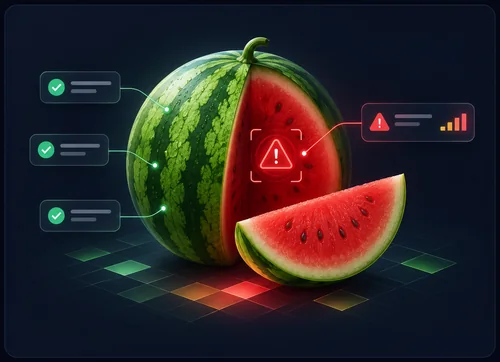
This is the same credential risk on the same day. The left side is what the quarterly review shows. The right side is what the tools reported this morning.
The heat map
The stack, this morning
Illustrative figures.
The same credential risk as above, on one slide: the KRIs that moved, which way they moved, and the loss as a range.
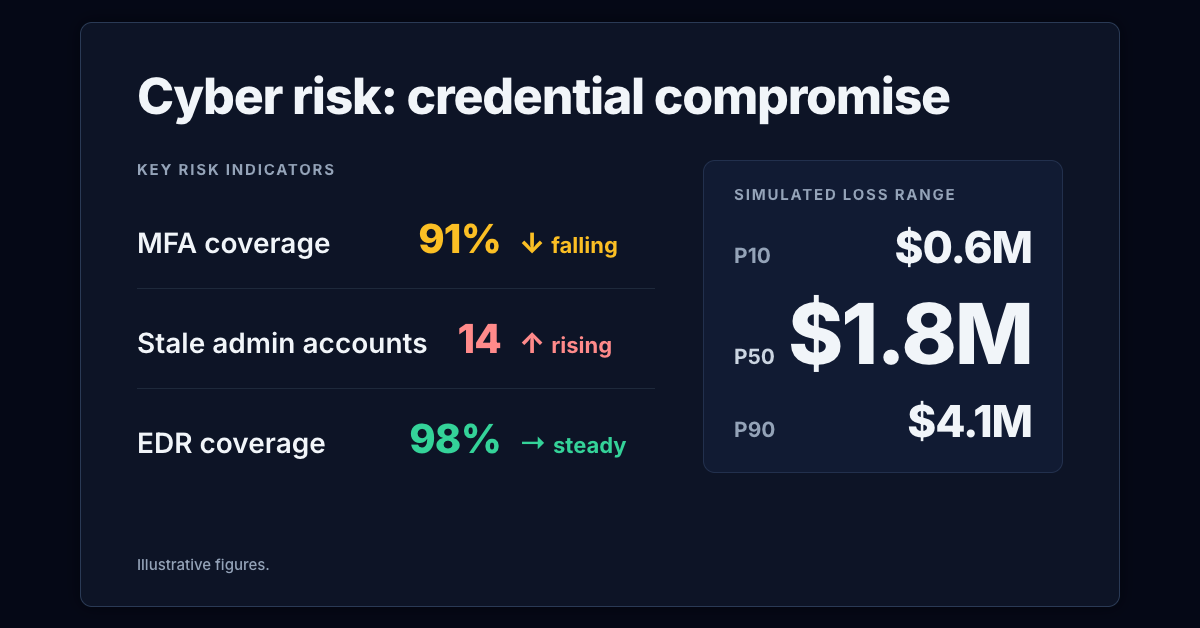
The figures above are illustrative. The demo is the real product, running on a sample company with Okta, Microsoft Defender, Tenable and KnowBe4 already connected. Three places to look first:
Each KRI names the tool that reported it, its warning and breach thresholds, and the NIST CSF 2.0 subcategory it maps to. Filter to red to see what is breaching today.
The Watershed links each risk to the controls that mitigate it and the KRIs that measure those controls. Click any node to drill in.
The simulation gives an expected annual loss, a P90 bad year and the median cost of a single incident. Then it checks how much of that the cyber policy on file would pay.
Everyone who opens the demo shares it, and it resets every day at 08:00 UTC. Connecting real systems is switched off, so seeing your own stack takes a call.
The first live picture lands in under 48 hours. Nobody fills in a spreadsheet to get it.
Draxis gets read-only API access to EDR, SIEM, CSPM, identity and vuln scanners. 28 native connectors cover Okta, Defender, CrowdStrike, Tenable, Splunk, AWS and more, with MCP and a REST API for the rest. No agents to deploy.
180 KRIs map into the risk catalog, so your Risk Register is populated on day one. If a feed goes quiet, Draxis tells you. Unmeasured never shows up as healthy.
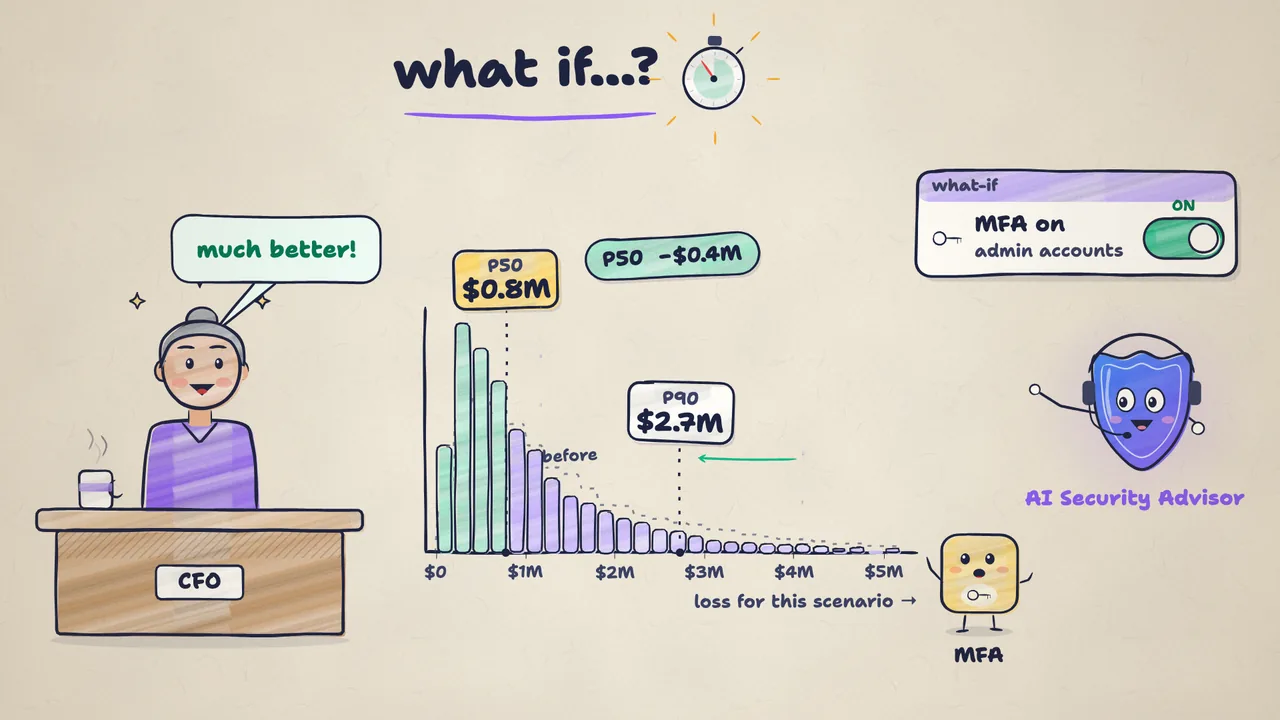
Draxis runs ten thousand Monte Carlo trials per scenario against your real assets, identities and data. You get a P10, a P50 and a P90 in dollars, plus what each control is worth.
It doesn’t manage controls, and it won’t help you pass an audit. Keep your GRC tool for that. Draxis tells you whether the controls you already run are working today.
There’s no questionnaire to fill in either, which is the whole point.
Fifteen domains mapped to all 18 CIS Controls v8.1, with green, amber and red thresholds and weighting guidance. No form and no email gate. If you’d rather build this yourself, start here.
Read the KRI Reference LibraryIt’s the real product running on a sample company, with Okta, Microsoft Defender, Tenable and KnowBe4 already connected. Everyone who opens it shares the same tenant, it resets every day at 08:00 UTC, and connecting real systems is switched off. Seeing your own stack takes a call.
The Cyber Risk Simulation Engine runs 10,000 Monte Carlo trials per scenario, drawing every loss from a range instead of a single guess. It runs against your real assets, identities and data, and it includes the regulatory fines where you operate. The simulation engine documentation covers the primitives, attack chains and fine models.
Draxis needs read-only API access to the tools you already run: EDR, SIEM, CSPM, identity and vuln scanners. No agents. If you would rather grant no tool access at all, there is a push-only option.
Draxis tells you. A measurement that has never reported is left out of the score, so unmeasured never shows up as healthy.
The call is thirty minutes. You tell us what you’re running and what you can’t answer today. We tell you straight whether Draxis reads it. You get a Zoom link and a calendar invite the moment you book.
Haven’t opened the demo yet? Explore it first. There’s no signup.
Tell us what the demo didn’t answer and we’ll reply by email.
Thanks. We’ll reply to .
Want it sooner? Book a 30-minute intro call instead.