The KRI Pipeline
Every frame is drawn live in plain JavaScript on a canvas: hand-inked strokes, marker fills and line boil, all generated from code. Space plays or pauses, ← → seek, C toggles captions, F goes full screen.
0:01 Your security tools are measuring something every minute of the day.
0:06 The KRI Pipeline turns those measurements into Key Risk Indicators, automatically, with no mapping project.
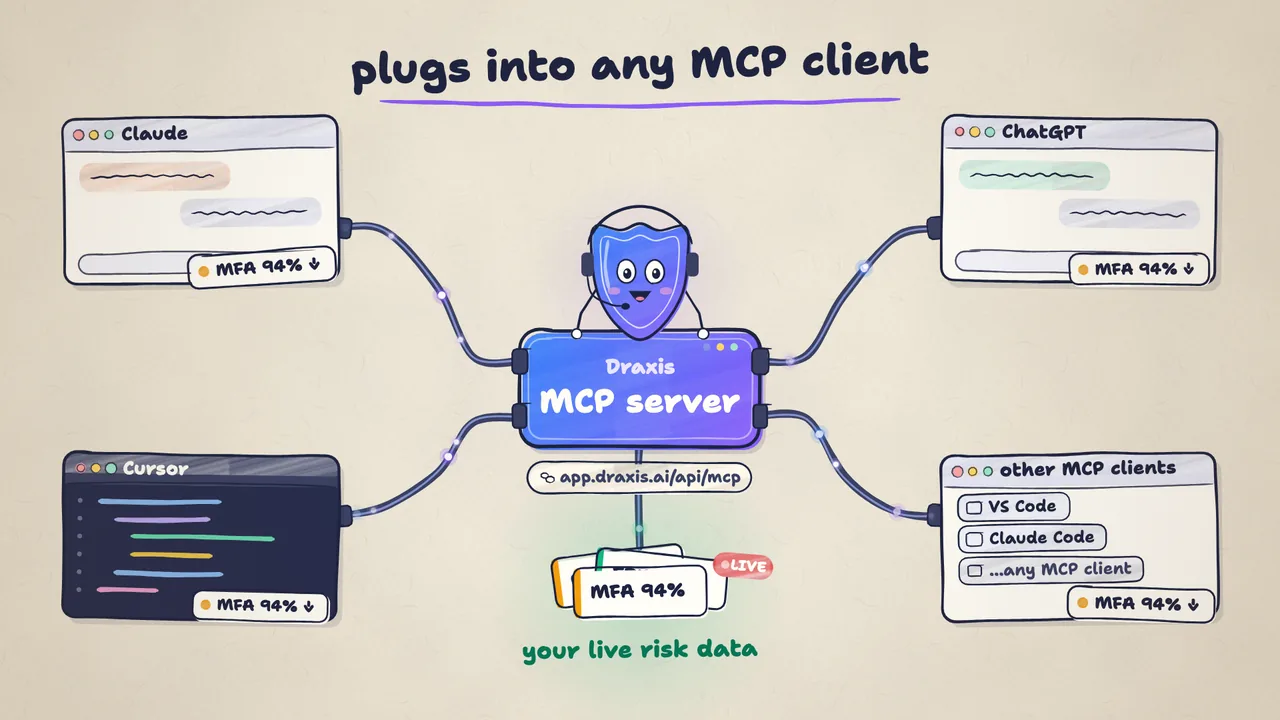
0:13 Connect a tool with read-only access, push values over MCP, or drop in a report, and AI pulls out each value and cites its source.
0:23 On the schedule you choose, every value lands on its KRI and is scored against your thresholds. Green, amber, or red.
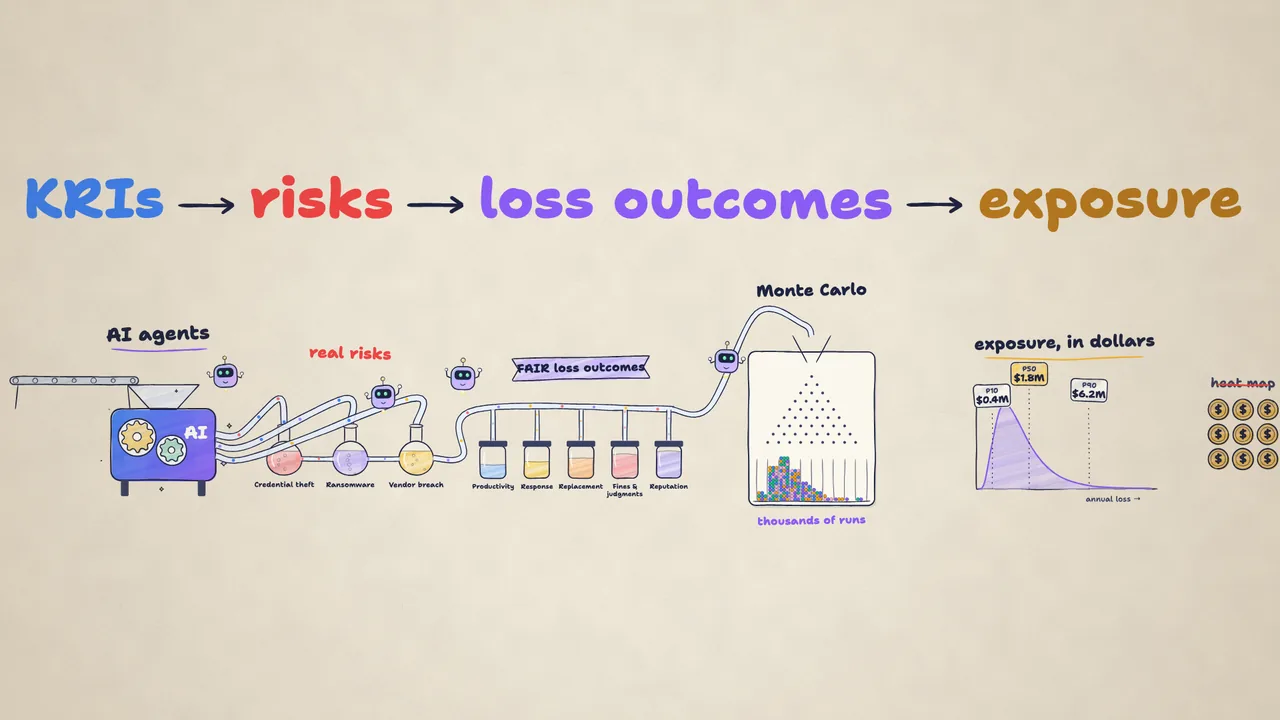
0:32 Each KRI rolls up to the controls, risks and business outcomes it touches, and anything the AI isn’t sure about waits in your inbox for review.
0:42 Because history is kept every day, you can spot the green KRI that has been quietly sliding for weeks.
0:48 And if a feed goes quiet, Draxis tells you. Unmeasured never shows up as healthy.
0:55 Draxis. Don’t wait for the breach to read the signal.
The KRIs and sources documentation covers thresholds, rollups, manual KRIs and MCP push. The KRI reference library lists all 180 signals, and the integrations directory shows which connector feeds which KRI.
On the platform page, the signal section shows how trending works across the whole stack.
Overview · 1:04Read the Signal
Deep dive 2 · 0:59The Cyber Risk Simulation Engine
Deep dive 3 · 0:59Early Warning & Draxis Axon
Deep dive 4 · 0:59The AI Security Advisor & Expert Panel
Deep dive 5 · 1:01The Partner Console for MSSPs
Deep dive 6 · 1:00NIST CSF & MITRE ATT&CK Mapping
Deep dive 7 · 0:59The Draxis MCP Server